Fridge temperature data: Handling heat
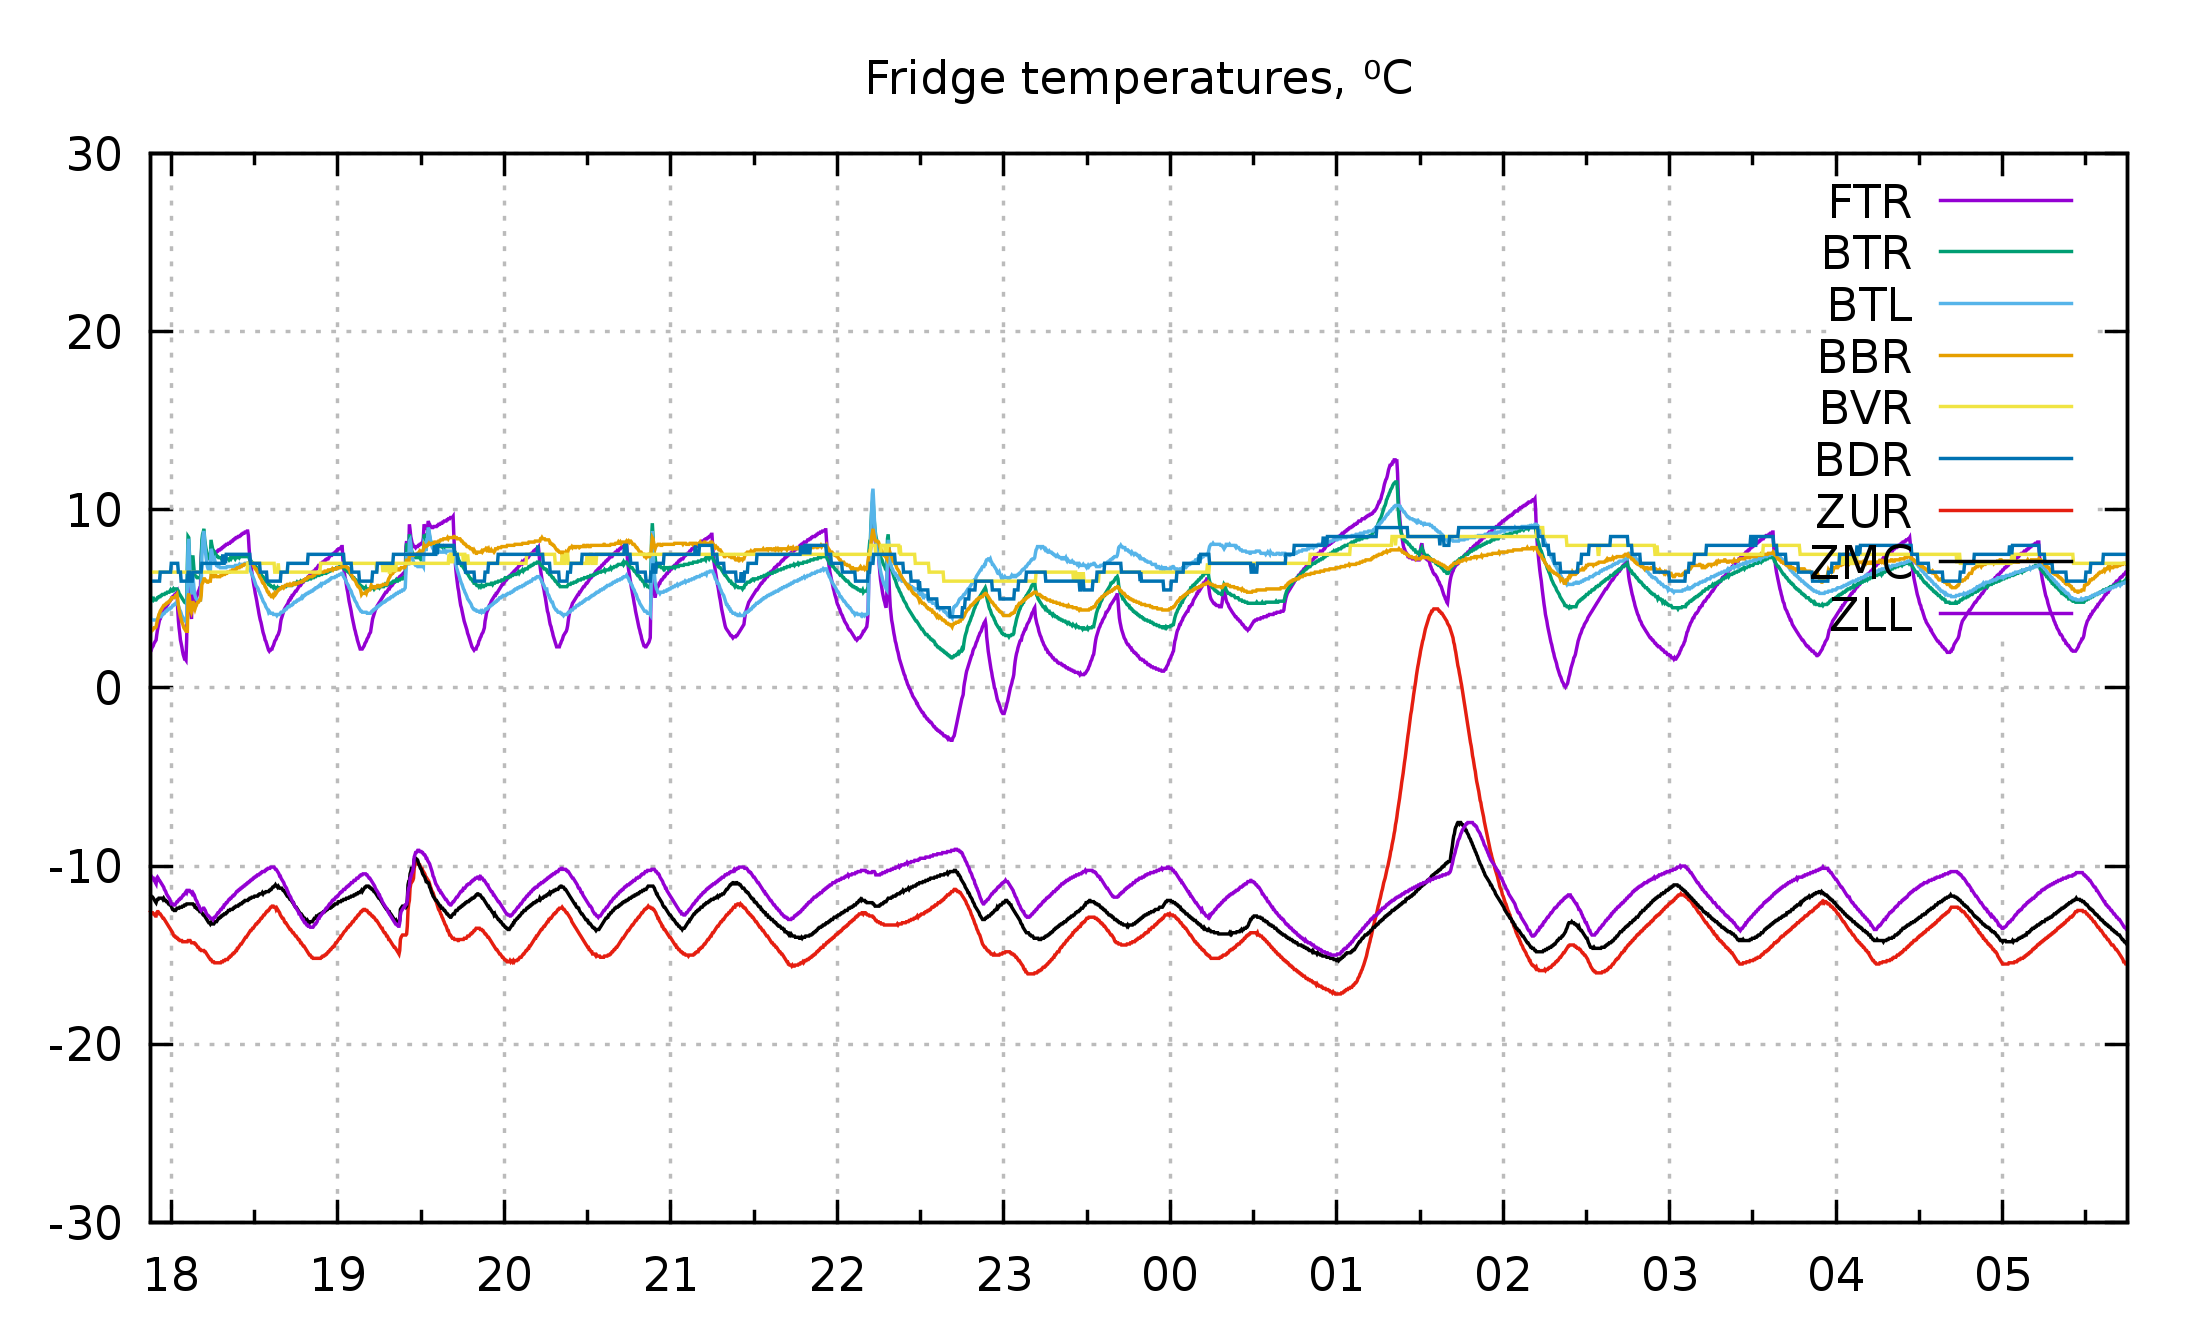
Last night, at about a quarter past ten, we took home-made stock out of the pot, barely less than boiling, and put it in the fridge. This morning, I was curious what putting about 4 quarts of very hot liquid in the fridge did to temperatures in the fridge, so I graphed the last 12 hours of temperature sensor data.
A very short spike in temperature associated with the sensor closest to the pot (BTL is back top left), then the fridge worked hard for about three hours keeping the temperatures good; front top right is even colder than average. By four hours after the event, the fridge had returned to normal cycles.
This graph also shows a defrosting event in the freezer (Z) overnight; notice that only the upper-right temperature spiked during the defrost; the middle center and lower left sensors barely noticed.
Eugene Crosser February 07, 2017 11:25
Would be interesting to plot the ratio of running time / full time of a cycle.
Michael K Johnson February 07, 2017 16:44
I’ve thought about plotting on/off duration delta but never cared enough to do the work instead of all the other things I also want to do… :-)
John Pitney February 17, 2017 20:59
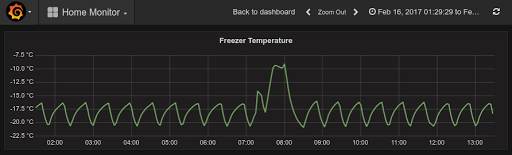
Here’s what my garage deep freeze on/off cycles and defrost look in the wintertime.
John Pitney February 17, 2017 21:00
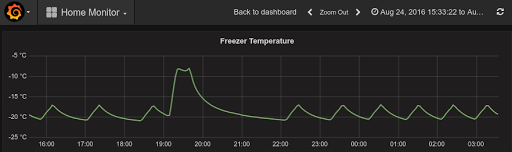
…and here’s the same unit on a hot summer day.
Michael K Johnson February 17, 2017 21:03
It’s not just me! :-)
It’s cool (no pun intended) that the decay curve is visible for warming in the winter and cooling in the summer.
John Pitney February 17, 2017 21:19
Sadly, I only have one DS18B20 in my freezer. :-)
I do have another on the outside of the freezer to log the garage ambient. It helped satisfy my curiosity about how much the garage heats up after parking a hot car inside: roughly 1 degC.
The two DS18B20s are attached to a NodeMCU board, which gets polled every few seconds by a Python script on a Raspberry Pi 2, which stores the data in an InfluxDB database and serves it up with a Grafana dashboard.
I’m always trying to add some new kind of measurement to be logged to InfluxDB. I’ve got network traffic, WiFi signal strength, printer toner level, lmsensors stuff from a few computers, ADS-B data collected from an RTL-SDR, HVAC duct temperatures, indoor humidity, watt-hour counts, and so on. It’s hard to think of a nerdier hobby.
Imported from Google+ — content and formatting may not be reliable